
Learning data: optimize and personalize your digital training with data

“Data” is becoming increasingly popular, putting numbers behind intuitions that often turn out to be right. The use of LMS, SPOCs and e-learning modules is spreading and makes it possible to collect more and more information about the learning experience. But are we really making the most of this data once the training is rolled out? Teach Up shares key insights about learning data to help you quickly optimize your digital training programs.
Learning data: a valuable resource
In 2021, training professionals face many challenges: making remote learning mainstream while maintaining engagement, leveraging collaboration, betting on experiential approaches... What if learning data could help you tackle these challenges?
What is learning data?
The term “learning data” refers to all the information collected from digital or blended learning experiences.
These data can take several forms:
- Descriptive: providing raw numerical information (number of clicks, number of correct answers on a quiz).
- Predictive: showing how behaviors evolve when learning a new skill or competence.
- Prescriptive: revealing gaps or weaknesses in the learning path, for instance.
Learning data therefore helps instructional designers facilitate deployment and optimize training updates.
Why collect and analyze learning data?
A data-driven strategy can serve multiple goals:
- Improve a learning path: identify what engages participants and what holds them back, to make training more effective.
- Identify gaps in a course: know what’s outdated, underperforming, or needs updating.
- Track learner progress: understand who learns what, when, and how quickly.
- Prevent dropouts: spot at-risk learners early on to personalize support and boost engagement.
- Continuously improve the experience: enrich core content, energize delivery, and add new resources.
- Know your audience: grasp preferences, acquired knowledge, and preferred formats to create a more personalized experience.
How to analyze learning data without being a data scientist
You don’t need an overly ambitious strategy to leverage your data effectively. Follow these four steps to get started with confidence.
1. Define your goal.
What are you looking for? Setting a clear objective is the first step in building an effective learning data strategy.
For example: identifying less engaging content to replace it, checking quiz success rates to gauge overall learner level, or personalizing support for struggling learners.
2. Collect the data.
Once you’ve identified your goal, gather the relevant information. If you’re using an LMS, you can usually retrieve it directly from the dashboard.
3. Analyze the data.
Compare the data and look for emerging trends. Create a dashboard to centralize insights, and if needed, use data visualization tools (Infogram, Mixpanel, etc.) to better represent your findings.
4. Build an action plan.
Once you’ve analyzed your data, it’s time to act. Structure a step-by-step plan to incorporate your observations.
Which metrics should you track first to boost digital training?
Here are five key metrics to focus on when optimizing your digital and blended learning experiences.
Completion rate
This measures the percentage of learners who complete the training.
Example: if many learners drop out at the same stage, you may need to boost engagement or adjust the resources at that point.
Time spent
This helps instructional designers check whether actual durations match what was expected. In some cases, it’s also required for compliance or funding purposes.
Note: In blended learning, in-person and AFEST sessions may not appear in dashboards, but they should still be factored in.
Mastery rate
A key metric for adapting and personalizing training. It shows how often a learner is prompted and responds correctly — whether through knowledge checks, social learning activities, or practical exercises.
Percentage of correct answers per question
Unlike mastery rate, this focuses on collective performance at the question level. It’s useful for identifying difficult topics that may need additional explanation or resources.
Number of interactions
A strong indicator of engagement. You decide which interactions to measure: clicks on dynamic inputs, memo downloads, collaborative wall posts, submitted questions, or participation in virtual classes.
While these figures help clarify possibilities, each analytics strategy should be tailored to the specific challenges you want to solve. It’s up to you to choose the right metrics to quickly and effectively optimize your digital training.
Teach Up helps you measure training impact
At Teach Up, we believe measurement tools are essential in training. To make life easier for our clients, we provide dashboards and complete analytics tools to track and analyze learning data across modules and programs.
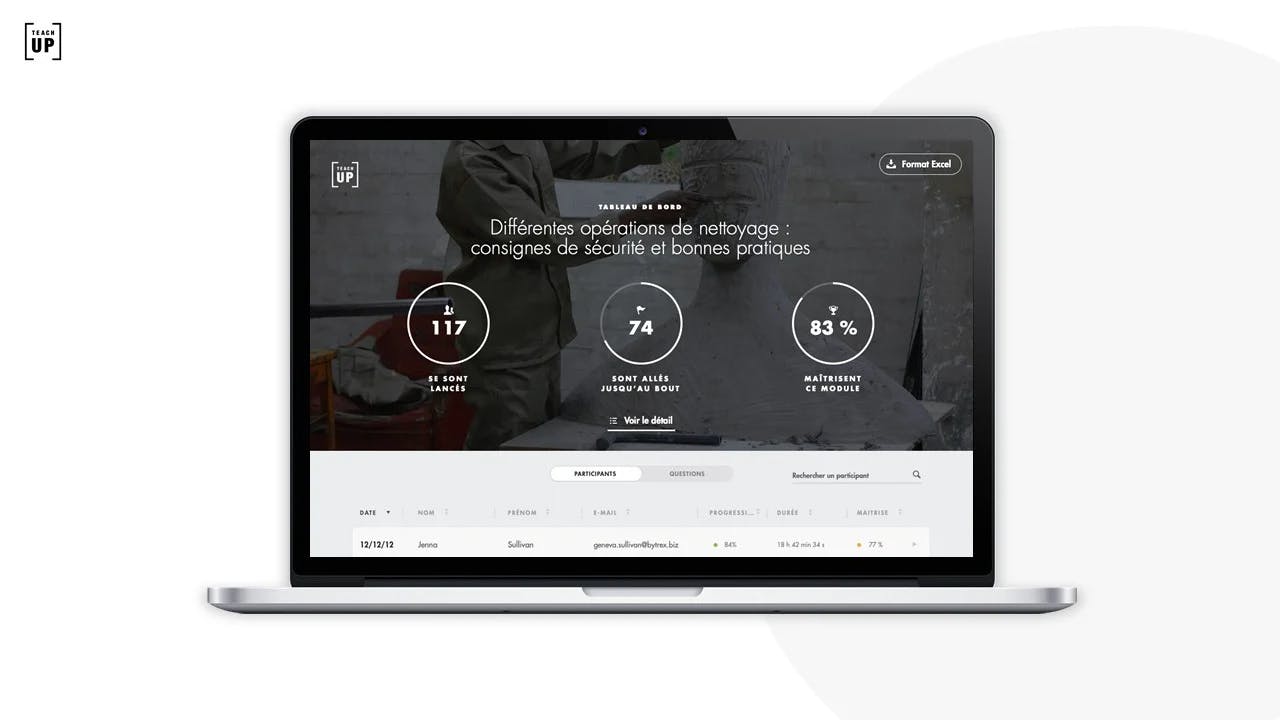
The Teach Up dashboard
This is the key tool in our LMS: a dynamic dashboard that lets you visualize learning data in real time. Completion rates, mastery rates, time spent, quiz results — all indicators are centralized for quick, comprehensive analysis. Bonus: the data can be exported in Excel format.
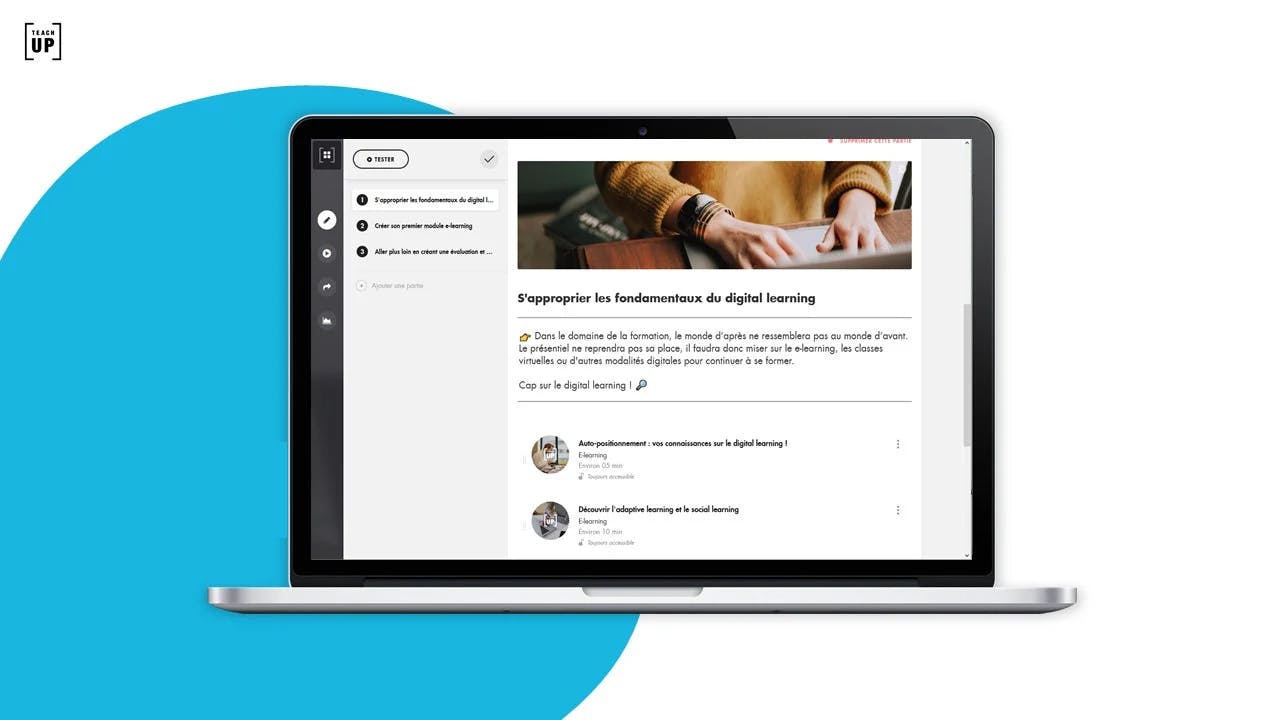
The Teach Up SPOC
Implementing a learning data strategy means reinventing the learner experience. To support this, Teach Up has created a premium immersive mini-site editor — also known as a SPOC (Small Private Online Course) — that allows you to centralize all your learning resources in just a few clicks.
Want to know more about Teach Up?
Book a meeting with one of our experts and learn more about us